

Back-of-the-Envelope - Official Guidelines
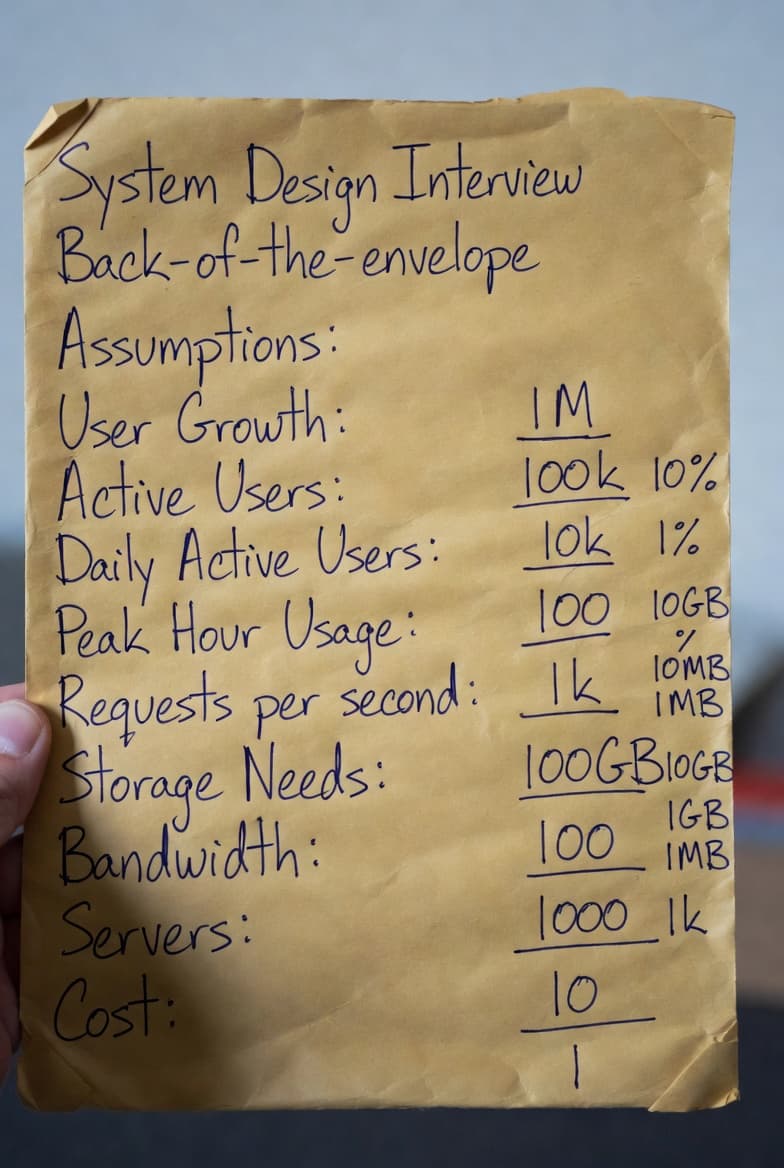
📊 When designing a system, these calculations are done before diving into building the application. Engineers need an estimate of whether or not their app will meet growing demand as it scales. You can perform an "estimate" of system capacity or performance requirements before building your applications to identify if you are correctly allocating the necessary resources. These are calculations you can perform on the back of an envelope, hence the term.
🎢 What happens without this estimate? Teams often over-provision or under-provision infrastructure, creating costly operational waste or performance bottlenecks.
To make this easy, you'll need to be comfortable with these concepts and the charts I've created to simplify your learning process compared to more technical versions:
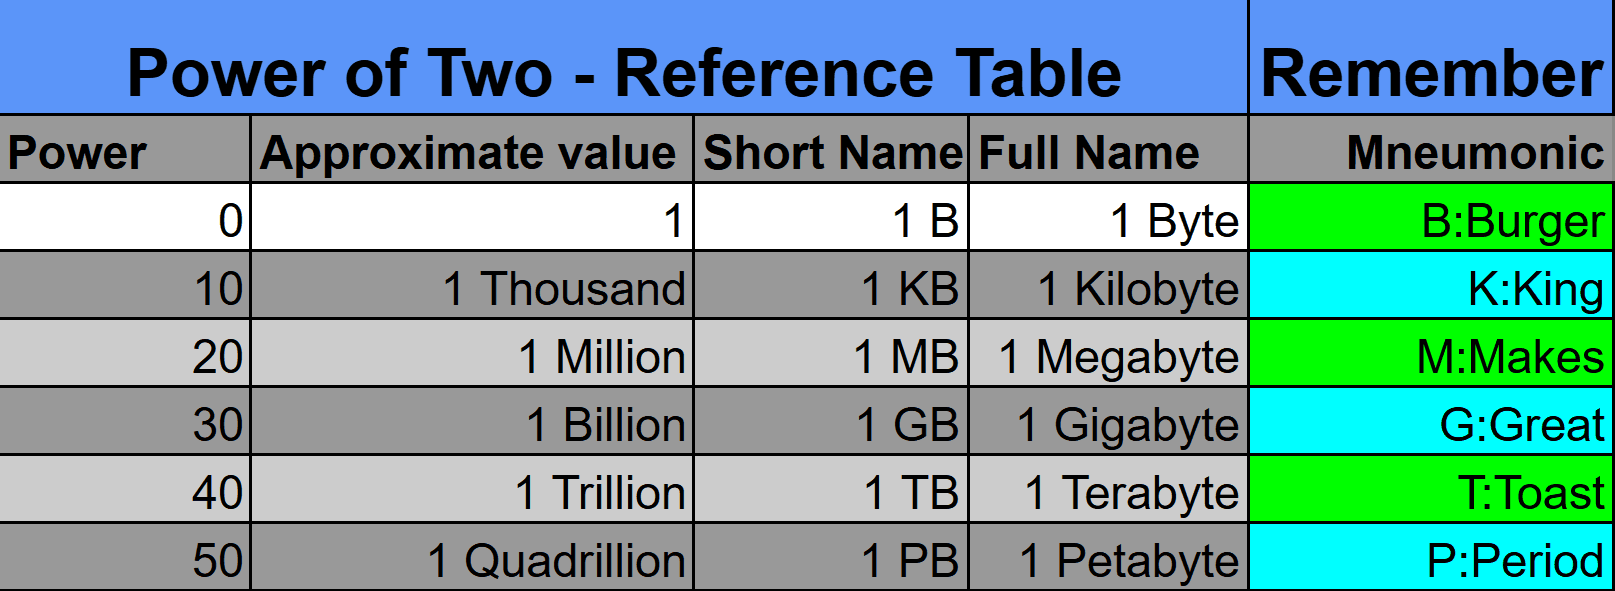
Power of Two
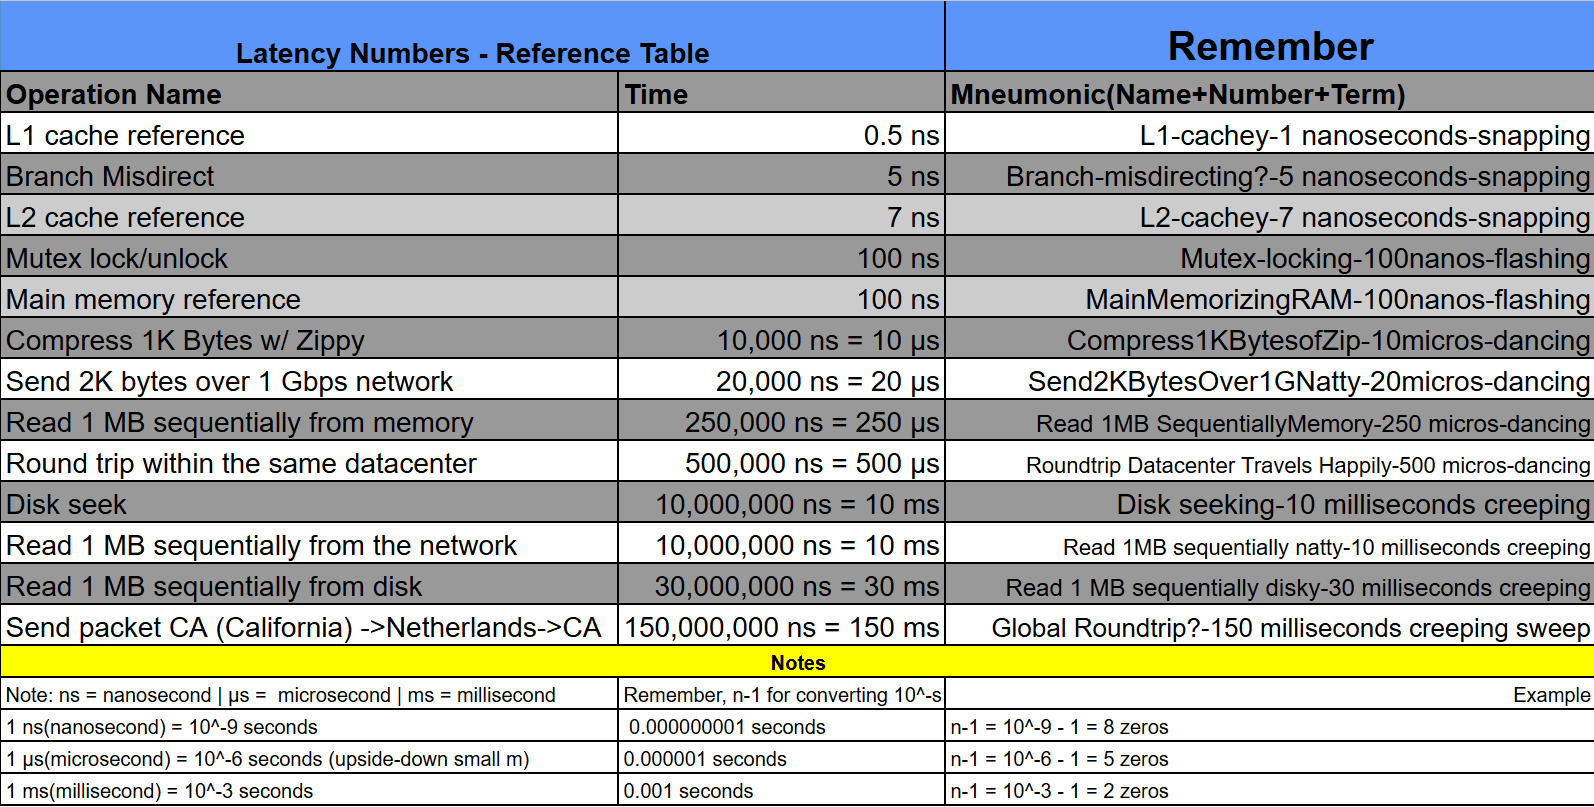
Latency Numbers Every Software Engineer Should Memorize
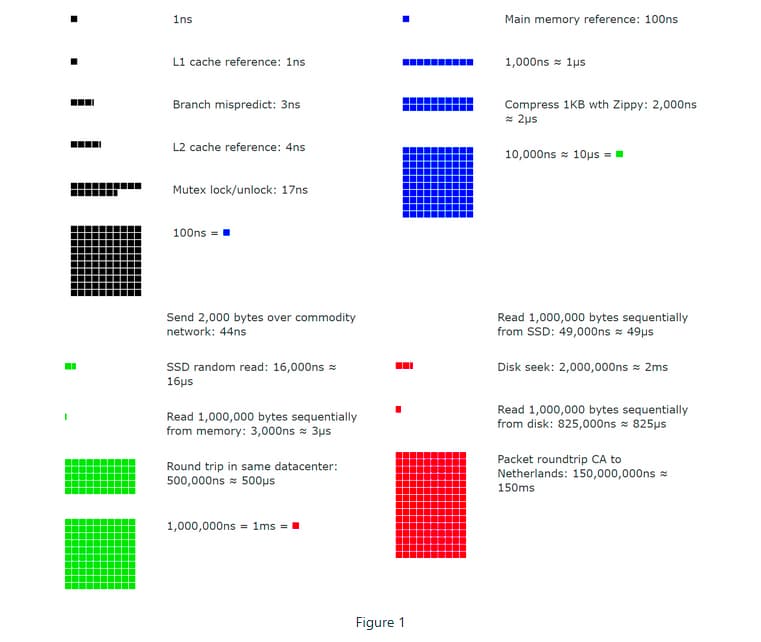
Google Software Engineer Visualization Tool to Enhance Latency Chart Understandings
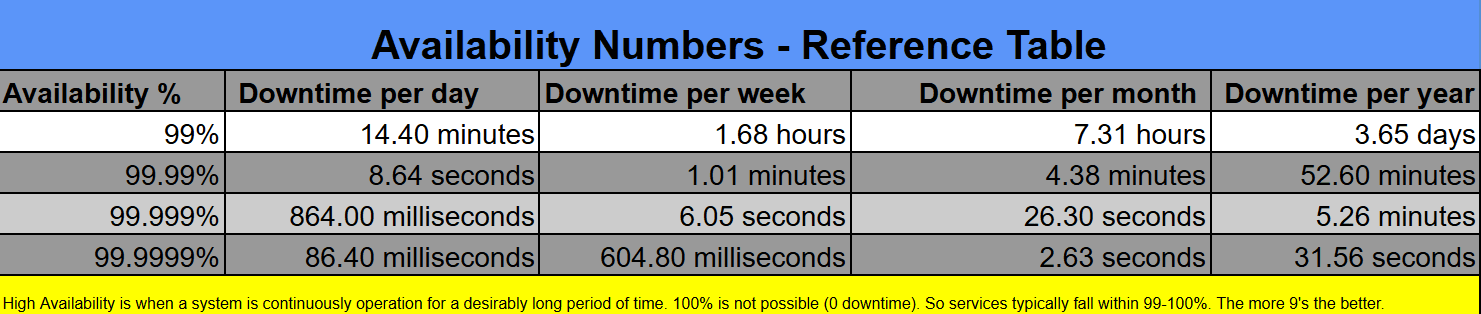
Availability Numbers
How to Understand Back-of-the-Envelope Calculations (Exercises)
Now that you're familiar with these concepts, we can apply the data in the charts to an actual back-of-the-envelope calculation.

In these exercises, we are estimating queries per second and 5-year media storage.
Here are the assumptions for building.
- 300 million monthly active users.
- 50% of users use Twitter daily.
- Users post 2 tweets per day on average.
- 10% of tweets contain media (images, videos, etc.)
- Data is stored for 5 years.
Estimations:
Queries per second estimate (QPS) estimate
- Daily active users (DAU) = 300 million
- We need to deduce, so multiply 300 million * 50% since our assumptions stated 50% of users use Twitter daily.
-(300 * 50% = 150 million) - Tweets QPS, how do we break this down into the parts required to build the equation? Look at the information in the assumptions.
Equation Pieces: How to gradually build the equation.
[Hint: Reference Assumptions Given Above]
- Users per day? 150 million users per day is the calculation from #1
-(150 million) - Tweets per day on average? Users post 2 tweets per day on average
-(150 million * 2 tweets) - How many hours are in a day? 24 hours
-(150 million * 2 tweets / 24 hr) - How many seconds in an hour? 60 minutes * 60 seconds in an hour = 3600 seconds
-(150 million * 2 tweets / 24 hr / 3600 seconds ≈ 3,500 Tweet QPS)
Alternatively: Look at the equation pieces like this
-([UsersPerDay] * [AvgTweetsDay] / [HrsDay] / [SecondsHr] ≈ Tweet QPS)
-(150 million * 2 tweets / 24 hr / 3600 seconds ≈ 3,500 Tweet QPS)
This is about ~3,500 Tweets QPS. We are now done calculating the first part of the QPS estimate.
Time for the second part! We have to now calculate Peak Load to account for unexpected spikes in peak times of users. Almost done!
Now, industry standards for estimating "Peak Load" are around 2x-5x multiplier. By multiplying by 2, you are estimating that during "rush hour" of your app, traffic will be roughly double the daily average.
All we have to do is multiply by these multipliers and we'll be finished with this estimate.
So Peak QPS = 2 * 3,500 = ~7,000 Peak Tweet QPS.
Media Storage Estimate
Using a similar formula, we will now estimate media storage
Try to understand or write out the sequence of steps in the equation like we just did above.
Here are the parts of the equation you are given, now try to piece them together and understand why for each part of the equation.
Average tweet size:
- tweet_id-64 bytes
- text-140 bytes
- media-1 MB
- Media storage: 150 million * 2 * 10% * 1 MB = 30 TB per day
- 5-year media storage: 30 TB * 365 * 5 ≈ 55 PB
So the answer to finding the media storage for 5 years is ~55 Petabytes.
The answer is around ~55 petabytes! The ~ symbol denotes an estimation.
So you'll need to buy roughly 55 petabytes of data storage for a system with the given estimates in the original assumptions.
If you don't allocate around that amount, you may over-allocate or under-allocate resources. This is why it's important to understand the end-game design before you build it out.
According to an estimated cost breakdown, 55 petabytes will cost around $13.75-$27.5 million dollars for the hardware alone. You are essentially building a small data center! If you under-allocate your system will buckle under daily usage and if you over-allocate you are wasting costly resources.
Part 2: What do interviewers look for when answer this question?
The main point? Interviewers want to test your problem-solving skills and ability to explain the process. They care far more about your mental model and communication than getting the "correct" number down to the last decimal.
✅ Tips for solving these problems:
- Round Aggressively: It is perfectly acceptable to simplify complex numbers. For example, instead of 86,400 (seconds in a day), most candidates use 100,000 to make mental math instant. 🔟
- Order of Magnitude Matters Most: Interviewers are looking for "ballpark" figures. Is this 10 servers or 10,000? A slight rounding error won't change your architectural decisions, but a math magnitude mistake might. ⚾
- Scientific Notation is Your Friend: Instead of writing out 1,000,000 use 106. It makes multiplying and dividing huge numbers (like traffic vs. storage) much harder to mess up. 🔟 🔼 🔢
- Add a Buffer After Rounding: Since you are approximating, it's common practice to round up at the end or add a "safety buffer". You can say something like "We calculated we need 10 servers, but I'll provision 15 to handle peak spikes". ⏫
- Write Down Your Assumptions: It's a good idea to write down your assumptions to be referenced later. If your assumption (e.g., 100MB per video) is way off from what they had in mind, they can correct you before you do all the math. ✍
- Practice Labeling Your Units: When you write down "5", does it mean 5KB or 5MB? You remove confusion and mistakes by labeling your units properly. Keeping units consistent prevents the most common math errors. 🏷️
- Practice Makes Perfect: While I could provide some exercises for you, learning happens when you go out of your way and do the hard work yourself. Research practice exercises or have AI design practice exercises. 🖨️
Commonly Asked Back-of-the-Envelope Estimations
Here are some of the most frequently requested quantities in system design interviews:
- QPS (Queries Per Second)
- Peak QPS (Peak Queries Per Second)
- Storage (daily, yearly, multi-year)
- Cache size / hit ratio requirements
- Number of Servers / Machines
- Bandwidth usage
- Etc.
Final Thoughts & Next Steps
I've laid the basic groundwork. Now you should be able to learn how to do back-of-the-envelope calculations rather quickly. Make sure to practice so you're fully comfortable, and then continue to master the skill by practicing against real practice problems that are asked. Once you're good, start timing yourself to improve your speed. AI can provide real-time feedback and simulate the interview environment. ⏲️
Summary
Thank you for reading my blog post!
To continue learning the fundamentals of System Design, the next important fundamental to learn is understanding...
Make sure to check out the additional blogs here for materials to help you throughout your learning journeys!